March 2026
Neonatal Calf Diarrhea Panel Results: 2025
By Gregg A. Hanzlicek, DVM, PhD, PAS
The graphs below describe the PCR test results for samples submitted to the KVDL in 2025.
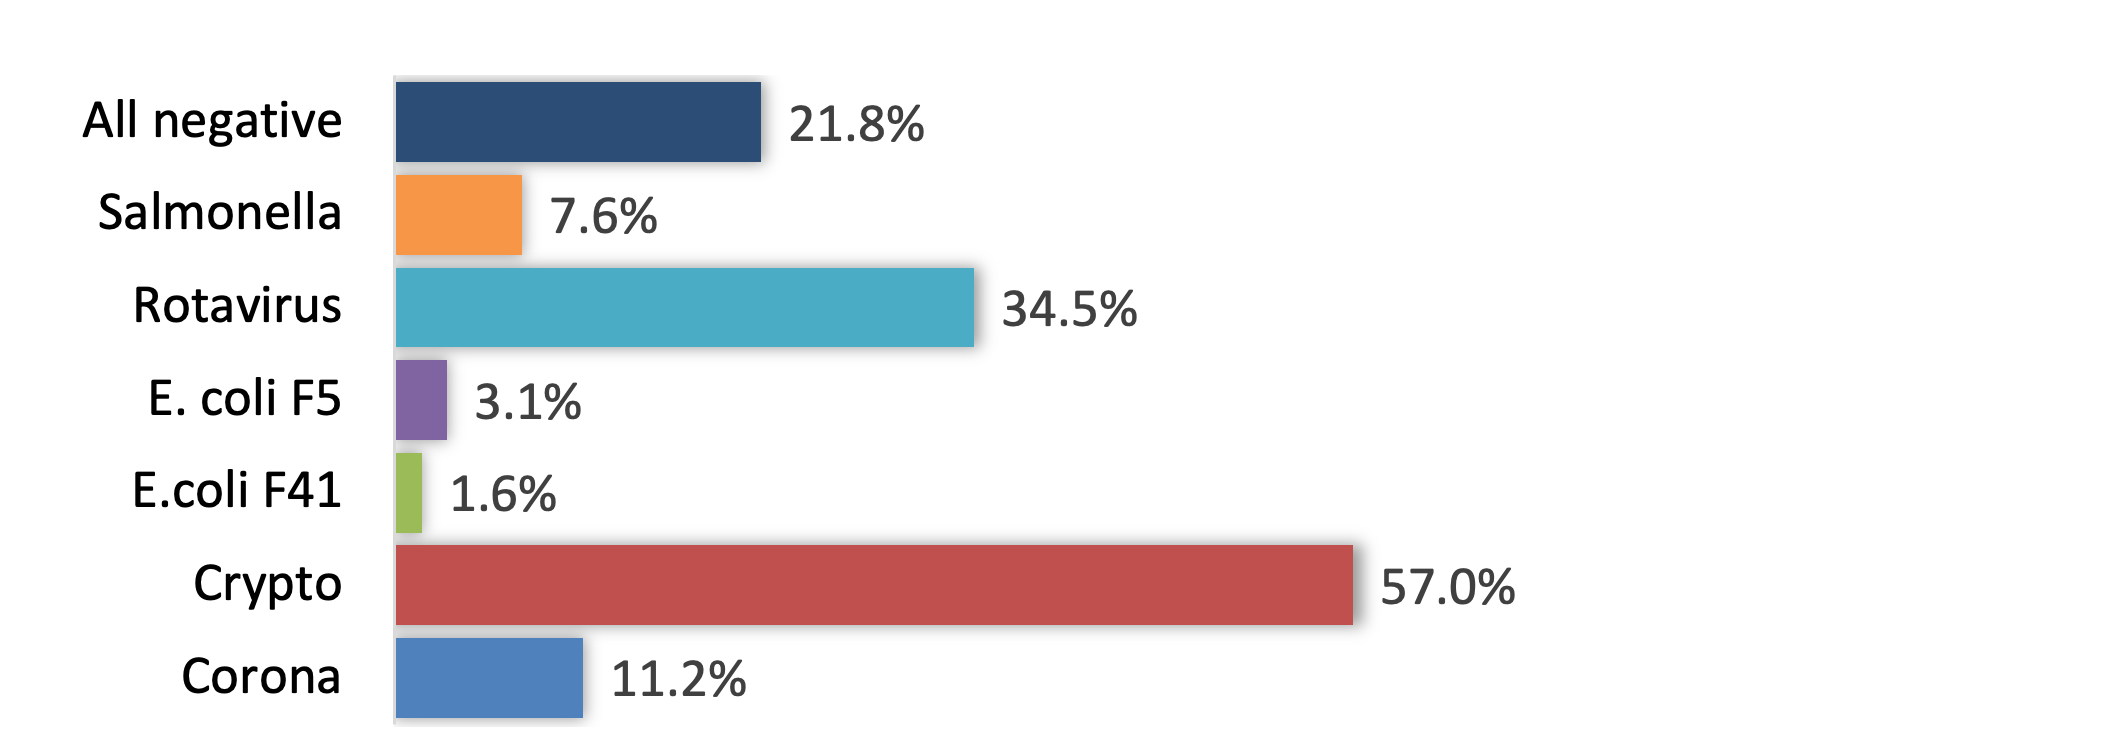
Approximately 22% of the samples resulted in negative results. Swab samples were 3 times more likely to be negative compared to fecal samples. Graph 1
Over 50% of the samples contained Crypto sp. and over 30% contained Rotavirus. Graph 1
Graph 1. Percentage of Samples Negative or Containing Each Pathogen.
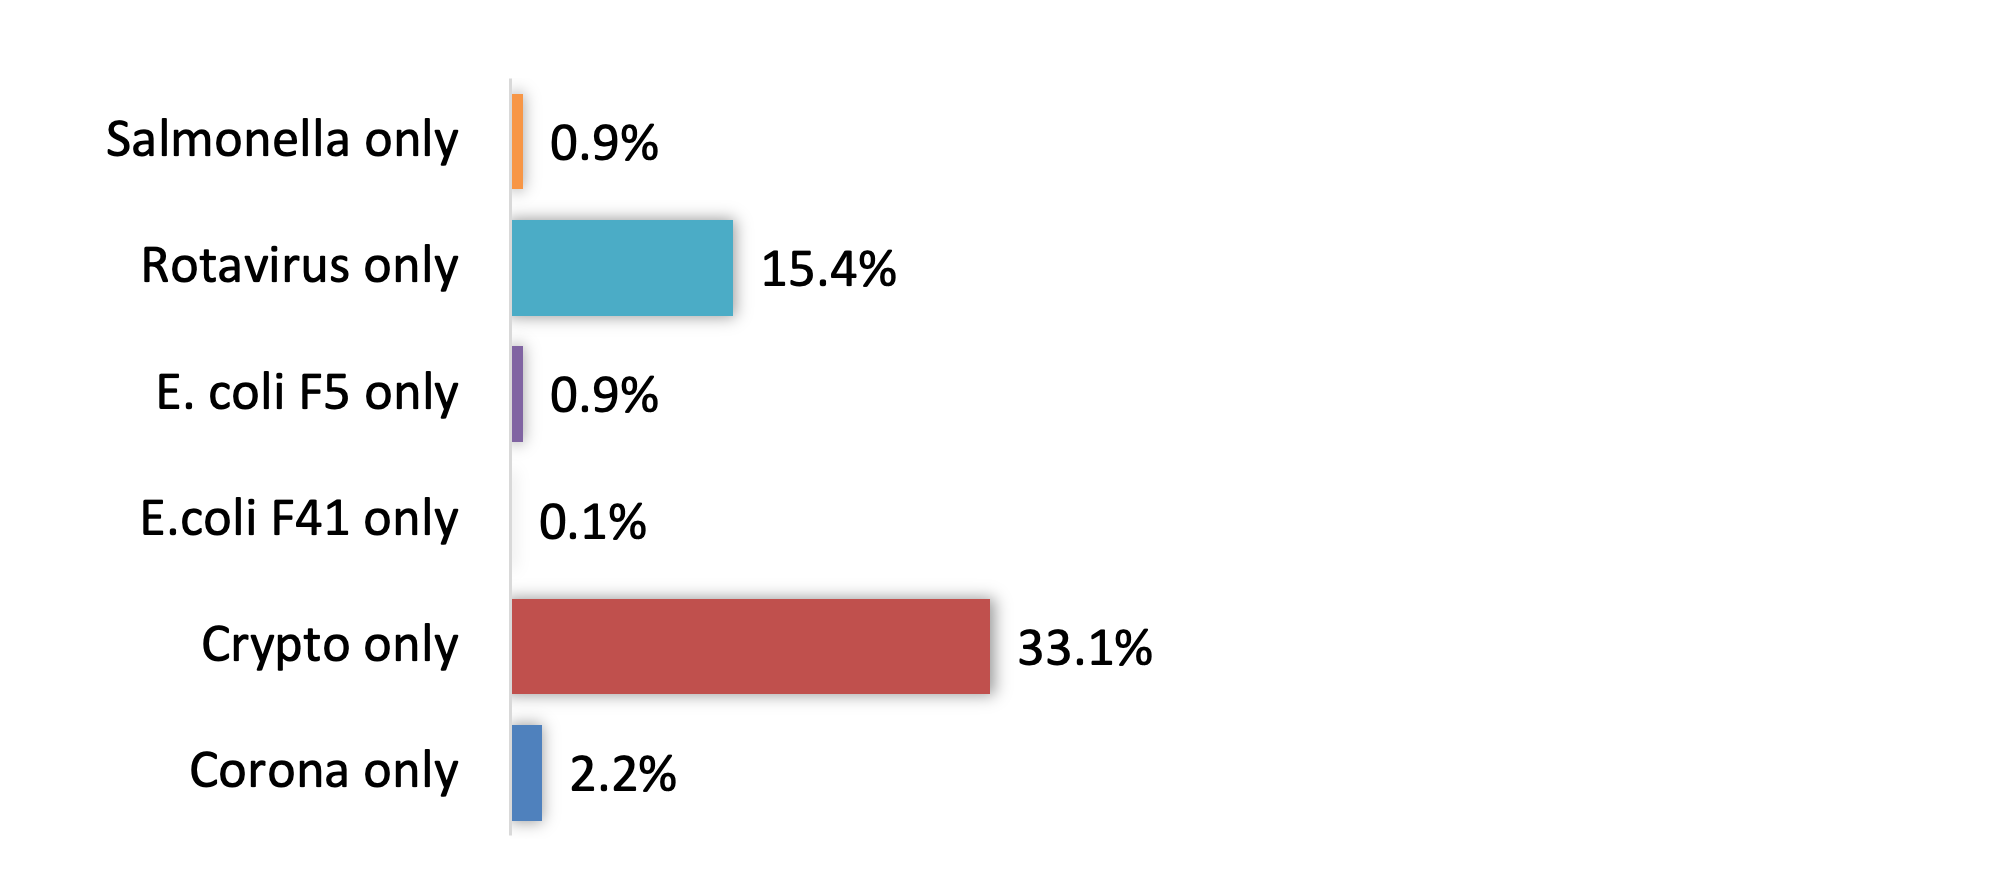
Cryptosporidium sp. was the pathogen most likely reported as the only pathogen contained in the sample. About ½ as many were found with only Rotavirus. Graph 2.
Graph 2. Single Pathogen Positive Samples
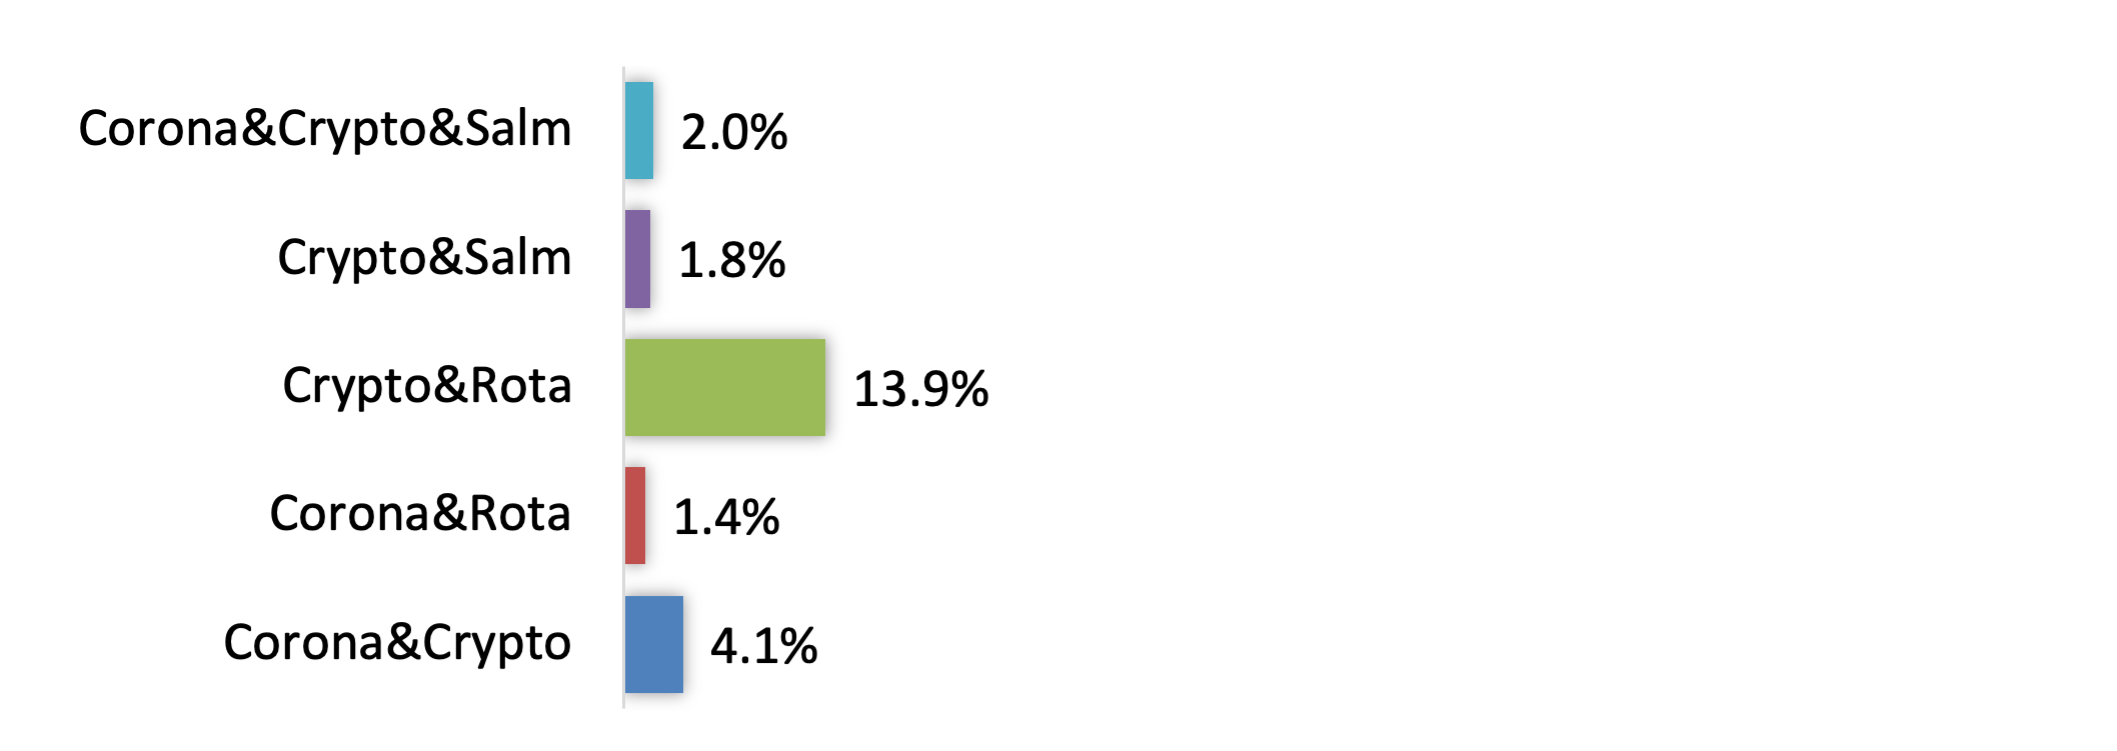
Data was analyzed investigating all 2, 3, 4 pathogen combinations. Cryptosporidium sp. and Rotavirus were the most common combinations. Other combinations were uncommon. Graph 3.
Graph 3. Percentage of positive samples and the most common pathogen combinations.